Overview
This beta guide explains how to review daily business performance using the dashboard summary view, then drill into the numbers that changed most.
Before you begin
- Confirm you have reporting access permissions.
- Confirm your location and timezone are set correctly.
- Decide the exact date range you want to analyze.
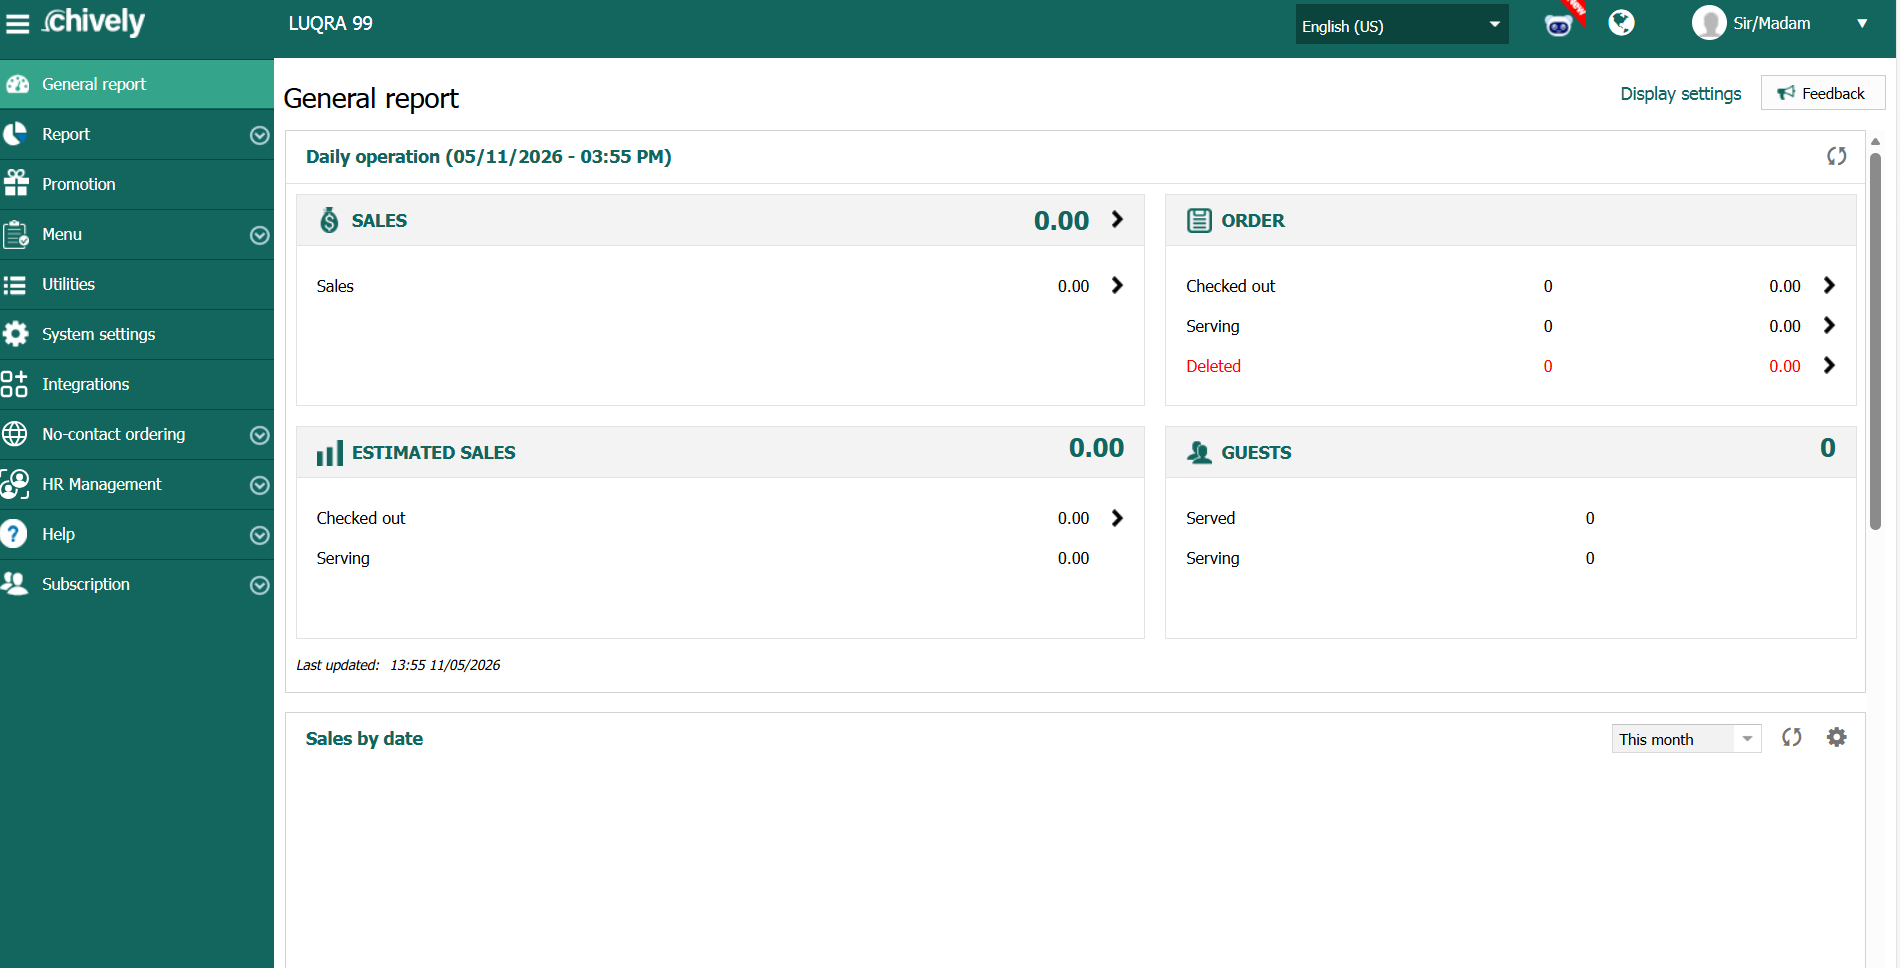
Steps
- Open the reporting dashboard and select the target location.
- Set the date range to the business day or period you want to review.
- Confirm the timezone is correct before reading totals.
- Review top-line metrics first: gross sales, net sales, order count, and average check.
- Compare current-period performance to the previous period shown in the dashboard.
- Identify outliers (large drops/spikes) and open the related detail view for validation.
- Record key findings for shift handoff, including any anomalies that need follow-up.
Verification
- Sales and order totals align with expected activity for the selected period.
- Location and timezone filters are correct and consistent with operations.
- Manager notes include at least one actionable insight from the dashboard.
Source reference to adapt
Need help?
For further support, reach out to your Chively sales agent.